

Financing Gas Stations
Gas stations are special-use properties that most lenders are scared to touch. Some of their fears are irrational and simply come from being inexperienced with the property type. On the other hand, some of their fears are quite rational and are based on their difficulty of getting reliable valuation services. Our knowledge and experience helps lenders understand why they should lend on gas stations. That is invaluable for the dealer looking for a gas station loan.
Bridging the Borrower-Lender Gap
The world of finance and the world of petroleum retailing have their own languages. The reality is that most gas station dealers don't speak the lenders' language, and very, very few lenders speak the dealers' language. With our experience in both of those worlds, we act as a translator, helping the lender to understand the dealer's business and helping the dealer understand the issues the lender faces. When you skillfully bridge those two worlds, the odds of getting a loan succesfully closed go way up.
Acting As A Firewall
Under the best circumstances, getting a loan for a commercial property is a stressful process. Trying to get a loan on a gas station, especially in the current economy, is incredibly challenging and stressful. Lenders have become highly sensitive to a wider variety of risks, some of which are real and some of which are not. Even so, perception is reality. When we serve as your mortgage broker, we insulate you from the stressful, ongoing interactions with lenders, allowing you to focus your time and energy on activities that are rewarding and fulfilling for you. Isn't that what life is all about?
Rates Are Staying Down...But For How Long?
Interest Rate Trends Since the Great Recession
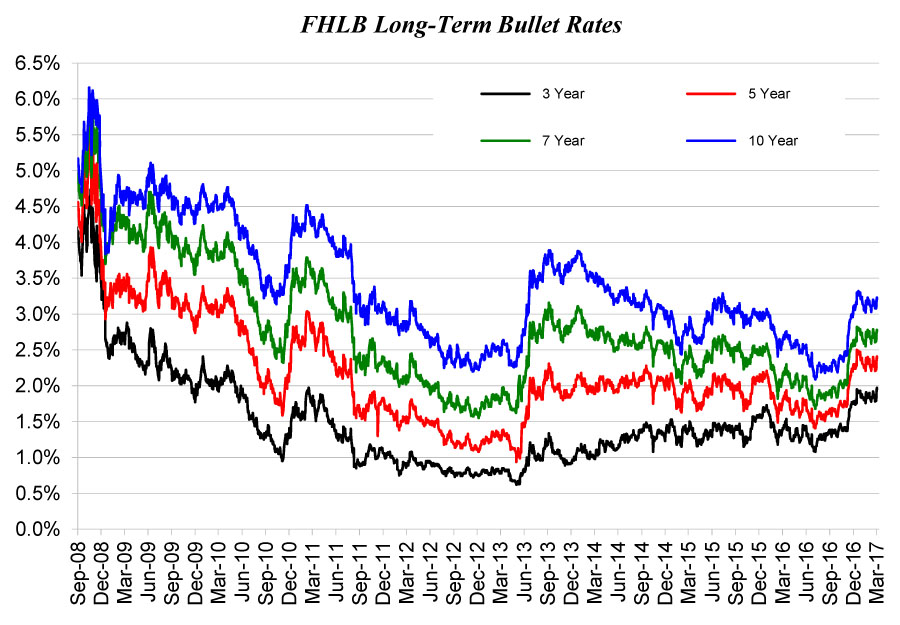
Lenders often price their loans using interest rates published by the Federal Home Loan Bank (“FHLB”) as the index rate. The adjacent chart shows the FHLB's rates since the Great Recession began for 3-, 5-, 7-, and 10-year terms. The chart shows that FHLB rates were quite volatile over the fourth quarter of 2008, then they dropped by about 150 to 250 basis points in the early months of 2009 and largely stayed flat through the first quarter of 2010. Weak economic data caused rates to drop by about 100 basis points over the remainder of 2010.
Signs of potential economic recovery in the first months of 2011 caused rates to bounce back up nearly to levels seen during 2009, but by the third quarter of 2011 the economic data clearly showed the recovery had not taken hold and rates dropped back down. Rates slowly dropped by about 25 to 50 basis points up until the second quarter of 2013, when fresh signs of a potential economic recovery caused rates to jump by about 25 to 150 basis points. Rates largely stayed flat across the remainder of 2013. Since 2014, the economic data has shown that yes, we are actually in an economic recovery, but it is a weak and slow recovery with conflicting economic signals. As a result, shorter-term rates have slowly increased while longer-term rates have declined.
Signs of potential economic recovery in the first months of 2011 caused rates to bounce back up nearly to levels seen during 2009, but by the third quarter of 2011 the economic data clearly showed the recovery had not taken hold and rates dropped back down. Rates slowly dropped by about 25 to 50 basis points up until the second quarter of 2013, when fresh signs of a potential economic recovery caused rates to jump by about 25 to 150 basis points. Rates largely stayed flat across the remainder of 2013. Since 2014, the economic data has shown that yes, we are actually in an economic recovery, but it is a weak and slow recovery with conflicting economic signals. As a result, shorter-term rates have slowly increased while longer-term rates have declined.
Interest Rate Spreads
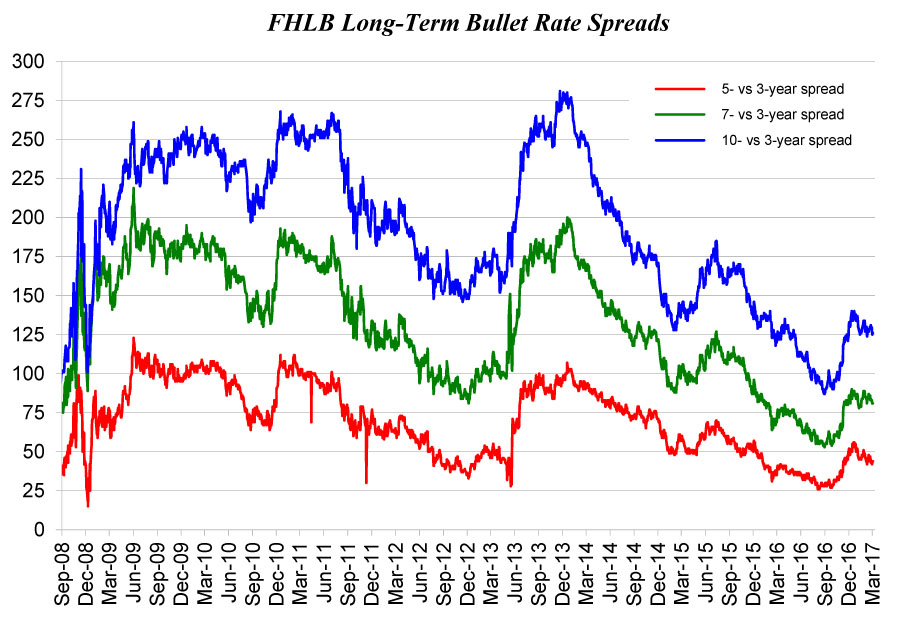
The further one projects into the future, the greater the uncertainty of projecting economic conditions. Greater uncertainty equals greater risk. The cost of that higher risk is reflected by the differentials between the 3-, 5-, 7-, and 10-year interest rates. The adjacent chart shows the rate spreads between those different rates.
What is most important to note about the chart is that the spreads between 3-year and 10-year rates has been declining since the end of 2013. Indeed, the short/long-term rate spread is lower than it has been at any time since the Great Recession began. This reflects the fact that the market thinks short-term conditions are likely to continue well into the future. These rate spreads are unlikely to last.
Interest Rate Trends Since the Election
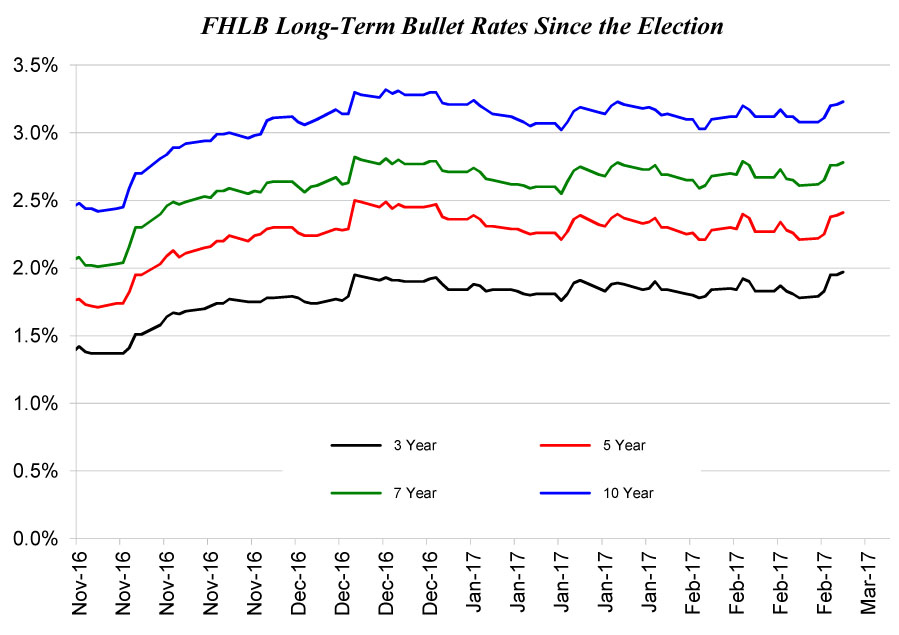
Rates stayed low and stable up until the election on November 8, 2016. After the unexpected election results, markets became more optimistic about future economic conditions in response to then-President-Elect Trump's campaign promises to decrease regulatory burdens, repeal and replace the Affordable Care Act, and reduce federal tax rates. Over the five weeks following the election, FHLB rates increased about 57 to 84 basis points. However, as the campaign promises began to intersect with the reality of Washington DC politics, the markets became more uncertain about the future, causing FHLB rates to decline somewhat, generally staying within a range that is about 42 to 64 basis points above where they stood on November 8. With the market-driven rates increasing, the Federal Reserve is now feeling more comfortable with raising the federal funds rate. Indeed, in mid-December, the Federal Reserve raised their key benchmark rate for only the second time in a decade and they are talking about raising that rate another three times in 2017.
Interest rates are going to increase, as they have nowhere to go but up since they are at historical lows. Once interest rates go up, commercial real estate values will be adversely impacted. That means there is a unique window of opportunity to get long-term debt capital—a loan on a gas station—locked in place at great rates today. Who knows how long this window will stay open?
An article dated May/June of 2017 published by the CCIM Institute provides an excellent overview of where real estate markets stood as of the second quarter of 2017. Note that various asset classes are reacting differently to the uncertain rate environment and lodging facilities, the most similar asset class to gas stations that is widely tracked, have seen a decrease in property prices of -1% between November of 2016 and January of 2017. This may be a harbinger of price softening in the petroleum retailing industry.
Loan Pricing
In the third quarter of 2008, lenders were often quoting loan rates of 275 to 325 basis points over the FHLB index rate. On a five-year index rate, this typically yielded a loan rate in the range of 7.0 to 8.0 percent. The decline in the index rates during the intitial years of the Great Recession did not translate into lower loan rates because lenders substantially increased their pricing spreads, quoting loan rates that were 400 to 450 basis points over the index rate. As a result, net-net, the actual loan rates that were being booked in the years after the bubble burst were not materially different than before. This was a simple consequence of the freezing up of debt capital as lenders struggled with loan losses.
However, the lending climate has thawed significantly in the last two to three years as the economy has stabilized and recovery has taken hold in various economic sectors. Lenders' pricing spreads are down to 225 to 300 basis points over the index rate, yielding loan rates that are generally in the 5.0% to 5.5% range. Indeed, we have closed a number of loans over the last few years at loan-to-value ratios of 70%, amortization terms of 15 years, and interest rates of 5.0% to 5.2%. If you have the right project and need a gas station loan, this is a great time to act because the window of opportunity for getting cheap debt capital will be closing.